Software overview
OMArk is available as an open source command-line tool and a web server. The command-line tool is distributed as a python package on Anaconda, PyPI and GitHub (https://github.com/DessimozLab/OMArk). In addition to a query proteome, it needs only a precomputed OMAmer database, which is available for download from the OMA browser10.
The web server (https://omark.omabrowser.org) lets users upload a FASTA file of their proteome of interest and visualize or download the results once the computation is done, typically within 35 min for a proteome of 20,000 sequences. Additionally, users can interactively browse and compare precomputed OMArk results for over 8,000 annotation sets from the National Center for Biotechnology Information (NCBI), Ensembl and UniProt.
Query protein placement
OMArk takes as input a proteome FASTA file in which each gene is represented by at least one protein sequence. OMArk starts with OMAmer11, a fast k-mer-based method that assigns proteins to gene families and subfamilies (Fig. 2a), represented as hierarchical orthologous groups (HOGs)12. These gene families are predefined in the OMA database13 using over 2,500 species but could in principle be used with other databases using the HOG concept.
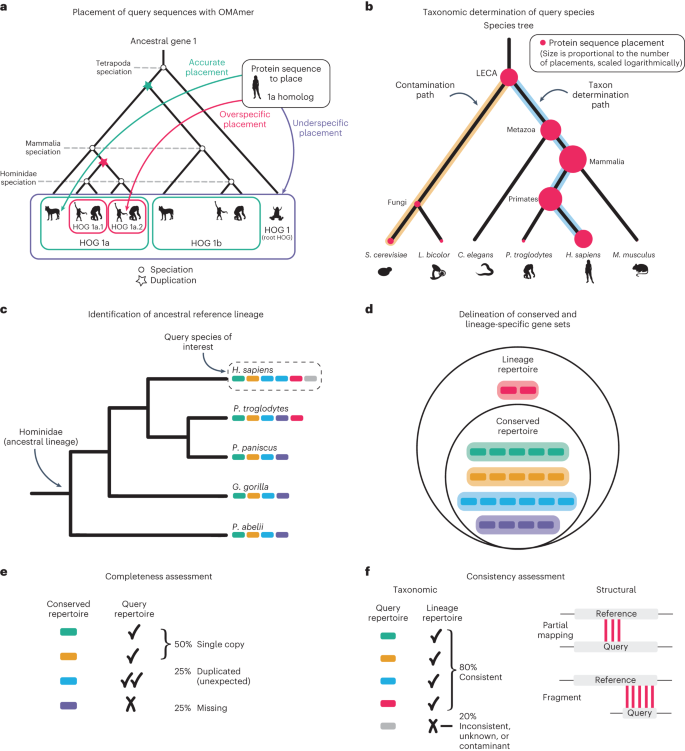
a, Sequences from the query proteome are placed into known HOGs using the k-mer-based fast-mapping method OMAmer. Shown is a gene tree with nested gene families (HOGs), delineated by speciation and duplication events. OMAmer provides accurate placement of protein sequences in their correct subfamily. b, The specific taxon of the query species is automatically determined by OMArk. Here, the species tree is shown, with protein placements represented by red dots. The size of the dots is logarithmically proportional to the number of placements in a typical scenario but simplified for this schema. The path to the query taxon (blue) is inferred based on the maximal number of placements, and the path(s) to contaminant taxa (gold) are determined as those with more placements than expected by chance. c, OMArk defines the ancestral reference lineage for a given query species as the most recent taxonomic level, including the species, and that is represented by at least five species in the OMA database. Here, a species tree is shown with colored bars representing individual genes. d, The conserved and lineage-specific gene sets. The conserved repertoire contains all the HOGs defined at the reference ancestral level that cover at least 80% of the species in the clade. These are gene families inferred to be present since the common ancestor. The lineage repertoire is a superset of the conserved repertoire, with the addition of genes that originated later in the lineage and are still present in at least one species in the OMA database. In the repertoires, genes from the different species are grouped into their HOGs. e, OMArk assesses completeness by comparing the conserved ancestral repertoire to the query protein sequences and classifying them as single copy, duplicated or missing. f, OMArk assesses consistency by comparing the query protein sequences to the lineage repertoire and classifying them as taxonomically consistent, inconsistent, unknown or contaminant. OMArk also assesses gene model structure by classifying query proteins as partial mapping or fragment. Shapes of species shown in a and b reprinted from Phylopic (www.phylopic.org). Silhouettes of Homo sapiens and Canis familiaris dingo by T. M. Keesey (public domain), Pongo abelii by Gareth Monger (CC-BY 3.0), Pan troglodytes by J. Lawley (public domain) and Xenopus laevis by Ian Quigley (CC-BY 3.0). Silhouettes of Saccharomyces cerevisiae by W. Decature (public domain), Laccaria by R. Percudani (public domain), Caenorhabditis elegans by J. Warner (public domain) and Mus musculus by S. Miranda-Rottman (CC-BY 3.0).
Source data
Species identification
To infer the species composition of the query proteome, OMArk tracks the protein placement into gene families and their taxa of origin (Fig. 2b). Ideally, a species’ proteome will have placements only into gene families from its ancestral lineage. For example, human genes will have originated at the common ancestor of primates, mammals and vertebrates, but not rodents. OMArk starts from this assumption and identifies paths in the species tree where placements are overrepresented, and it then selects the most recently emerged clade as the inferred taxon. If multiple paths are overrepresented, OMArk reports the most populated as the main taxon and all others as contaminants.
Ancestral reference lineage identification
Based on the main taxon placement, or a user-specified taxonomic identifier, OMArk selects an ancestral lineage: the most recent taxon that contains the species of interest and at least five species in the OMA database (Fig. 2c). The selected ancestral lineage is provided in OMArk’s output.
Completeness assessment
OMArk selects all gene families that were present in the common ancestor of the ancestral lineage and still are present in at least 80% of its extant species (conserved repertoire; Fig. 2d). The presence of these gene families serves as a proxy for its proteome completeness. OMArk reports the number of selected gene families, their identifiers and the proportion of the conserved gene families that are found in the query proteome as a single copy or duplicated (multiple copies) or are missing (Fig. 2e). An incomplete proteome would have a high proportion of missing gene families.
Contrary to BUSCO, the conserved genes are not necessarily expected to exist in single copies in extant genomes, although they were likely a single gene in the lineage’s ancestor. Thus, duplicated genes are classified as ‘expected’ if they correspond to a known duplication that occurred after the ancestral lineage’s speciation or ‘unexpected’ otherwise. If the ancestral lineage has a lower ploidy level than the query species due to subsequent whole-genome duplication (WGD; for example, ancestral diploid compared to a tetraploid), then the query proteome will appear as massively duplicated. Users should interpret the results in the context of their query species’ ploidy.
Consistency assessment
The main advantage of OMArk is that it evaluates the consistency of all the genes in the query proteome compared to what is known for its lineage, both taxonomically and structurally.
Taxonomic consistency classifies query proteins based on their taxonomic origin by comparing them to the lineage’s known gene families (lineage repertoire; Fig. 2d). Proteins fitting this lineage repertoire are classified as consistent, whereas those that fit outside are classified as either inconsistent or contaminant (Fig. 2f). The contaminant category contains all inconsistent placements that are closer to a contaminant species than to the main species, as determined by the species identification step. Proteins with no gene family assignment are classified as unknown.
Structural consistency classifies query proteins based on sequence feature comparisons with their assigned gene family. Proteins only sharing k-mers with their gene families over part of their sequence are labeled partial mappings, whereas proteins with lengths less than half their gene family’s median length are labeled fragments (Fig. 2f).
Taxonomic and structural consistency are complementary parts of the consistency assessment performed over the whole proteome and help identify annotation errors, a feature lacking in most quality assessment methods. A proteome with a high proportion of consistent proteins indicates more reliable annotation. Conversely, a high proportion of partial mappings and fragments indicates potential gene model inaccuracies. Inconsistent proteins suggest either gene families not previously identified in the target clade or, if they are primarily partial or fragments, sequences with biased composition. Similarly, unknown proteins may be sequences without close homologs or annotation errors. Thus, not all proteins classified as inconsistent or unknown are necessarily errors, but an unusually high proportion may indicate a systematic error in the annotation.
An example of the OMArk output for the Danio rerio proteome shows it has a high completeness (96.6%) and consistency (96.3%), as expected for a well-curated model species (Fig. 1b).
Validation on simulated proteomes
To evaluate OMArk’s ability to provide accurate quality assessment, we simulated cases of genome incompleteness, erroneous sequences, gene fragmentation or fusion, and cross-species contamination. We used two datasets of eukaryotic proteomes (Supplementary Table 1): a dataset comprising nine model species known for their high quality (model dataset) and a dataset including 16 species representing eukaryotic diversity and absent from the reference OMA database (representative dataset).
Simulated incompleteness
For each proteome in the datasets, we simulated incompleteness by removing varying percentages (10%–90%) of random proteins. OMArk’s results closely approximate the simulated completeness in most cases, although it tends to overestimate it (Fig. 3a and Supplementary Figs. 1 and 2). The error margin is lower in the model dataset (+2.3% on average) than in the representative dataset (+9.9% on average). For both datasets, OMArk’s performance is similar to BUSCO’s, but BUSCO overestimates completeness by a slightly smaller margin (+2.1% and +6.1% on average for the model and representative datasets, respectively; Supplementary Figs. 1 and 2).
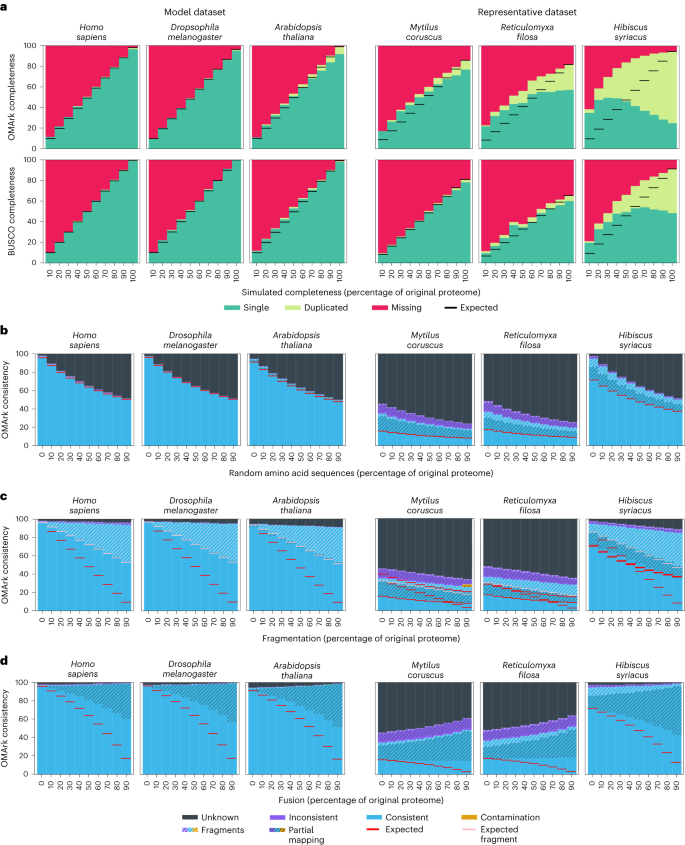
a–d, Three example species of the model dataset (left) and the representative dataset (right) are shown for each simulation. Each simulated error in panels a–d was applied to 10%–90% of the proteome (x axis). a, Simulated incompleteness. OMArk (top) and BUSCO (bottom) results for the datasets. Colors represent the part of the conserved gene set found in a single copy (green) or duplicated (light green) or are missing (red). The simulated completeness corresponds to the percentage of the genome that has been randomly selected in each simulation. Horizontal black lines show the expected completeness (that is, the measured completeness for the source proteome). b, Erroneous sequence simulation. Colors represent proteins which map to the correct lineage (consistent, blue), to another lineage (Inconsistent, violet) or have no homologs (unknown, black). Hashes indicate structural inconsistency relative to the gene family (either partial mapping (black hashes) or fragmented genes (white hashes)). The appended error (x axis) corresponds to the quantity of erroneous sequences that was added to the proteome as a percentage of its original protein number. Horizontal red lines indicate the expected number of structural and taxonomically consistent genes, considering the proportion in the source proteome and the known introduced error. c, Fragmented sequence simulation. The x axis corresponds to the percent of the proteome that has been fragmented. The pool of artificially fragmented genes are cut randomly to be between 10% and 90% of the original length of the protein. Horizontal red lines indicate the expected number of nonfragmented taxonomically consistent genes, considering the proportion in the source proteome and the known fragment rates; horizontal pink lines indicate this proportion if half of the fragments are detected. d, Fused sequence simulation. The x axis corresponds to the percent of the proteome that has been fused. Pairs of proteins are selected randomly and appended together to simulate fusion. The fused protein gets added to the proteome while the original proteins get removed. Horizontal red lines indicate the expected number of structural and taxonomically consistent genes, considering the proportion in the source proteome that have been fused. Ancestral lineages for the six shown species are Homo sapiens, Hominidae; Drosophila melanogaster, melanogaster subdivision; Arabidopsis thaliana, Brassicaceae; Mytilus coruscus, Lophotrochozoa; Reticulomyxa filosa, SAR (Stramenopiles-Alveolata-Rhizaria) supergroup; and Hibiscus syriacus, Malvaceae.
Source data
Both methods overestimate completeness in species with a high number of duplicated genes. This effect is expected, as reporting them as missing requires all copies to be absent. This trend is more pronounced in OMArk, because OMArk does not require conserved genes to be in a single copy in extant species, resulting in a more inclusive set of conserved gene families. Thus, because OMArk reports more duplicates, it overestimates completeness more than BUSCO. This trend is observed in both datasets but especially the representative dataset, as these proteomes have a higher average proportion of duplicated genes (8.4% for the representative dataset versus 2% for the model dataset).
This high level of detected duplication in the representative dataset can be explained by the selected ancestral lineages, which are more distantly related than those selected in the model dataset. Thus, ancestral gene families in the representative dataset may have had more time to undergo duplication. Furthermore, WGD events that occurred after the ancestral lineage can lead to high levels of reported duplication in OMArk and BUSCO. A striking example is the Hibiscus syriacus proteome, where OMArk reports nearly 70% of the genes as duplicates. These results are due to H. syriacus being a tetraploid, having undergone two WGD events after the last Malvaceae common ancestor14. Because the Malvaceae clade was selected as the ancestral lineage by OMArk, the higher number of duplicates corresponds to the genes that were retained as two copies or more after the WGD.
Simulated erroneous sequences
We simulated erroneous sequences by adding randomly generated sequences, from 10% to 90% of the proteome, to each proteome in the model and representative datasets. As a result, there was a corresponding increase in the proportion of Unknown proteins, given that these added sequences lacked detectable homologs (Fig. 3b). In all simulations, OMArk detected the expected proportion of taxonomically and structurally consistent genes, indicating that this category accurately represents the proportion of high-confidence coding sequences. Results were similar whether the sequences were generated from random nucleotides or designed to resemble the target species’ proteins (Supplementary Results: Simulation Results and Supplementary Figs. 3–6).
Simulated fragmentation
We simulated fragmented proteomes by randomly selecting sequences and then randomly removing between 10% and 90% of their length, ranging from 10% to 90% of the proteome. OMArk identified an increasing proportion of fragmented, taxonomically consistent proteins, reaching up to half the known number of fragmented sequences. This result is expected, as OMArk only identifies fragments that are less than half the gene family’s median protein length and thus will not detect fragments that are 51% to 90% of the original protein size. Given the modified expected fragmentation detection rate (only half the simulated fragments), there is only a slight underestimation of consistent, nonfragmented proteins: 0.6% for the model dataset and 1.8% for the representative dataset (Fig. 3c and Supplementary Figs. 7 and 8). We also detected a slight increase in unknown proteins, possibly because these fragments are too short to be detected as homologs of existing genes.
Simulated fusion
We simulated cases of fused protein-coding genes by merging pairs of randomly selected proteins, ranging from 10% to 90% of the proteome, and added them to the proteomes while removing the original proteins. We expected that OMArk would associate these fused proteins to one of the existing HOGs but as a partial match, as only part of the sequence would be in common with the HOG. However, the increase in partial mappings as the proportion of fused genes rises was less than expected. The proportion of structurally and taxonomically consistent genes was on average 17.6% higher than expected for the model dataset and 13% higher than expected for the representative dataset (Fig. 3d and Supplementary Figs. 9 and 10).
Simulated contamination
We simulated contamination by introducing sequences from bacteria, fungi, microbial eukaryotes or humans to the model and representative datasets. OMArk accurately identified the taxonomic origin of the contaminant, though its sensitivity varied, especially with a low number of contaminant proteins. For bacterial and fungal sources, contamination became detectable with as few as ten contaminant proteins, corresponding to ~10 kbp contaminant bacterial DNA or ~25 kbp fungal DNA. Contamination was reliably detected at 50 or more contaminant proteins (~50 kbp bacterial DNA, ~125 kbp fungal DNA). However, for other eukaryotic species, precise contamination detection required at least 100 to 200 contaminant proteins (~200–700 kbp free-living unicellular eukaryote DNA). OMArk missed contamination when the contaminant had no close relative in OMA or was too closely related to the contaminated species (Supplementary Table 2; Supplementary Results: Contamination simulation). Specifically, OMArk only detected human sequence contamination in vertebrates at high levels (1,000 proteins; ~150 Mpb human DNA) and not at all in mammals.
OMArk results for 1,805 eukaryotic reference proteomes
Comparing protein-coding gene annotations between closely related species, including one ‘gold standard,’ is essential to assess annotation quality2. Thus, we ran OMArk on a set of 1,805 Eukaryotic UniProt proteomes to serve as a reference dataset (Fig. 4 and Supplementary Table 3). We provide quality assessments for major clades and detailed analyses of specific proteomes with low-quality results in Supplementary Results: Results on UniProt Reference Proteomes. All results can be visualized on the OMArk web server (https://omark.omabrowser.org) and compared to those of closely related species.
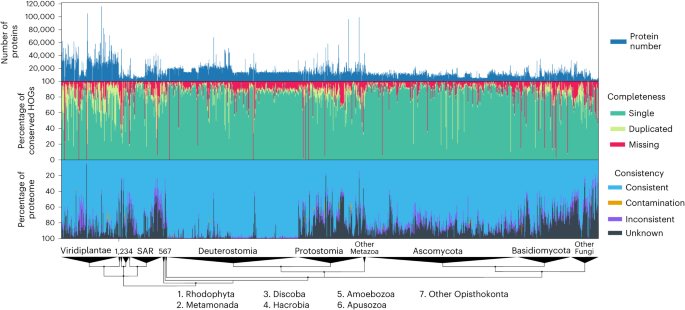
Bar graphs of the number of canonical proteins in each proteome (top). Completeness assessment showing the proportion of conserved genes (green) in the proteome, with a breakdown among single-copy (light green), duplicated (dark green) and missing (red) genes in all proteomes (middle). Consistency assessment showing the proportion of accurately mapped proteins (consistent; blue), incorrectly placed proteins (Inconsistent; purple), contaminant proteins (orange) and proteins with no mapping (unknown; black) (bottom). Genomes are ranked by taxonomy, with major eukaryotic taxa shown on a taxonomic tree at the bottom.
Source data
OMArk and BUSCO comparison
We compared OMArk and BUSCO for assessing completeness for the 1,805 Eukaryotic UniProt Reference Proteomes. We define completeness as the total percentage of conserved genes from either BUSCO or OMArk that are classified as single copy, duplicated copies or fragments in the query proteome (that is, not missing). Note that this differs from BUSCO’s definition of completeness, which does not include fragments. OMArk and BUSCO yield similar results overall, with a Pearson correlation of 0.86 for completeness across the 1,805 proteomes (Fig. 5). Disparities are expected, as OMArk considers both single-copy and multicopy genes, whereas BUSCO is restricted to single-copy genes. For 57% of the proteomes, BUSCO versus OMArk completeness differed by 5% or less. Where the difference was larger, proteomes considered more complete by OMArk typically exhibited more fragments, indicating OMArk’s ability to identify fragmented proteins without categorizing them as missing.
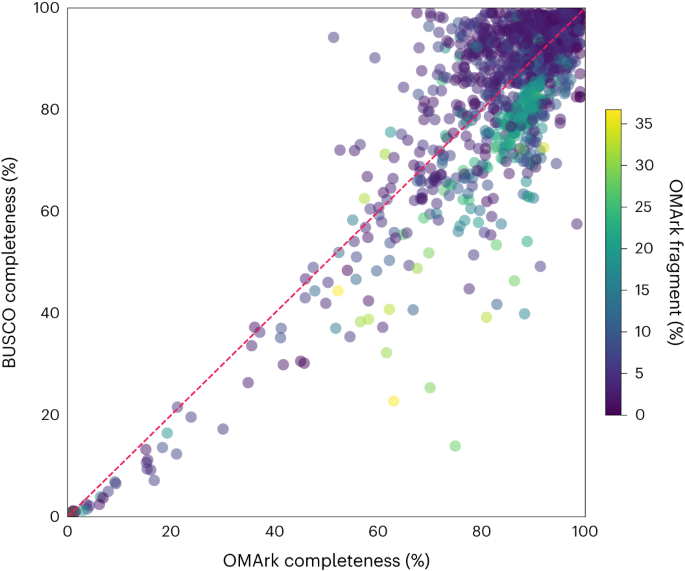
Each point on the scatterplot is one of the 1,805 Eukaryotic UniProt Reference Proteomes assessed by both methods. The x axis is the percentage of the conserved set of ancestral genes found in the query proteome by OMArk. The y axis is the percentage of BUSCO genes found in the query proteome by BUSCO. Both completeness scores include duplicated and fragmented proteins. Proteomes are colored by the percentage of fragments found in the proteome, as determined by OMArk.
Source data
The proteome’s lineage also influenced the disparity in completeness scores between BUSCO and OMArk. Certain BUSCO lineages, such as Liliopsida and Stramenopiles, were often deemed as more complete by BUSCO, whereas lineages such as Aves and Nematoda tended to be deemed as more complete by OMArk (Supplementary Fig. 14). This bias may stem from the number of ancestral genes assessed, as fewer BUSCO genes or conserved HOGs generally resulted in higher BUSCO completeness. Conversely, a higher number of BUSCO genes or conserved HOGs resulted in higher OMArk completeness. Additionally, when OMArk deemed a proteome as more complete, the OMA database typically had fewer species in the relevant clade than for proteomes where BUSCO estimated a higher completeness (Supplementary Table 7). Thus, the lineage and consequently the number of conserved genes used for assessment affects completeness in both BUSCO and OMArk. A larger set of conserved genes and more species in the lineage of interest likely lead to more accurate completeness assessments.
Runtime comparison over the same set of proteomes showed OMArk is generally faster in terms of total CPU time, with an average of 9.2 min per proteome for OMArk versus 25.2 min per proteome for BUSCO for all 1,805 proteomes. BUSCO’s runtime largely depends on the number of BUSCO genes used in the assessment, whereas OMArk’s runtime depends mainly on the number of proteins in the query proteome.
These results highlight the biases inherent in each tool. Ultimately, we advise to use both software packages to obtain the most informative gene repertoire quality assessment. More comparisons are detailed in the Supplementary Results: Comparison with BUSCO on UniProt Reference Proteomes.
Contamination in public databases
OMArk detected 124 contamination events across 79 of 1,805 proteomes, some with multiple contaminating species (list in Supplementary Table 4). Two of them, Ricinus communis and Lupinus albus, were found to be contaminated by ten and seven species, respectively (mostly bacteria and one fungus), indicating that extreme cases of contamination persist in public databases. We independently verified each contamination case using BLAST and BlobToolKit Viewer (Supplementary Table 4) and confirmed 117 (93.6%) of the contamination events in 73 species.
Error propagation in some avian proteomes
We detected widespread presence of fragmented genes in the 234 avian species from the UniProt Reference Proteomes (median proportion of taxonomically consistent fragments: 18.3%, standard deviation: 4.8%). However, this was not observed in well-studied birds such as chicken (Gallus gallus; proportion of taxonomically consistent fragments: 2.4%; Supplementary Fig. 18). The proportions of fragments depended mainly on the source of the proteome. Most of the highly fragmented proteomes originated from the same source, the Bird 10 K consortium annotation pipeline15, and tended to have fragments in the same gene families, suggesting systematic bias (Supplementary Figs. 19 and 20; Supplementary Results: Analysis of avian proteomes). Annotations for these genomes were performed using, among other sources of evidence, homology from the Ensembl 85 (ref. 16) annotation of zebra finch15 (Taeniopygia guttata; taeGut3.2.4 assembly). OMArk also detected a high proportion of fragments in this older version of the zebra finch proteome (proportion of taxonomically consistent fragments: 20.3%), but not in the latest version (0.5% of taxonomically consistent fragments; Ensembl 99 + ; bTaeGut1_v1.p assembly). Furthermore, a high proportion of genes fragmented in the Bird 10 K proteomes were also fragments in the older zebra finch proteome (Supplementary Fig. 21). These results suggest fragments in these bird proteomes likely result from propagation from the fragmented taeGut3.2.4 proteome.
Selection of high-quality proteomes among close species
OMArk’s quality assessment depends on the selected ancestral lineage. Thus, a best practice is to compare the results to species sharing the same ancestral lineage. We illustrate this by comparing the OMArk results of a model species, Mus musculus, with its close relatives within the Myomorpha clade, a group of mouse-like rodents (Fig. 6a). As expected, the well-curated species Mus musculus and Rattus norvegicus scored best, both in completeness and consistency. Several other species in the clade exhibited noticeable quality issues, despite being in the OMA database and contributing to the ancestral reference HOGs (for example, Cricetulus griseus). We observed similar patterns for other model organisms consistently ranking as the best proteomes in their clade (detailed in Supplementary Results: Comparison of proteomes from closely related species; Supplementary Figs. 22–30).
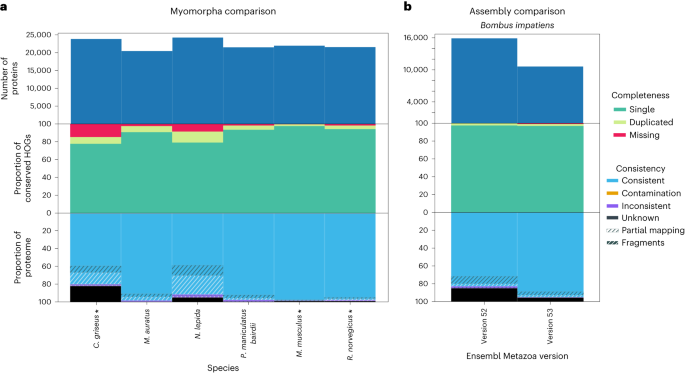
a, OMArk results for different Myomorpha proteomes. The species currently in OMA which contributed to the ancestral reference lineage gene families are shown with an asterisk. Mouse (Mus musculus) and the Norwegian rat (Rattus norvegicus) stand out as high-quality annotations. b, OMArk results for Bombus impatiens, comparing two different versions of the assembly. The newest assembly (version 53) shows an improvement in gene set consistency, with a slight decrease in completeness, although the number of proteins substantialy decreased.
Source data
These results demonstrate OMArk’s ability to identify the best-quality proteome in any clade of interest, which is useful for selecting representative genomes and for improving annotation of nonmodel species.
Assembly and annotation comparisons
OMArk can be used to compare gene repertoires from different assemblies or annotations of the same species, aiding in benchmarking annotation methods or gauging improvement in gene repertoire completeness and consistency over time. To illustrate, we ran OMArk on newer versus older assemblies or annotations for species with documented changes between the Ensembl Metazoa releases 53 and 5417. This corresponds to 11 protostome species with annotations on different assembly versions and seven nematode species with different annotations on the same assembly (Supplementary Table 5).
When comparing OMArk results across different annotation versions of the same assembly, we observed minor changes (less than 1% for most metrics), likely due to incremental annotation updates affecting few genes. Nevertheless, we still detected a trend toward fewer duplicated genes and more consistent genes (Supplementary Results: Assembly and annotation comparisons).
Comparing annotations on different assemblies, OMArk detects noticeable improvement in completeness and/or in structurally and taxonomically consistent genes for all but one species, but not always in both (Supplementary Results: Assembly and annotation comparisons; Supplementary Table 9). For instance, B. impatiens and Acyrthosiphon pisum showed a slight decline in completeness (−1.21% and −0.73%, respectively) but a large rise in taxonomically and structurally consistent genes (+17.34% and +21.06%, respectively; Fig. 6b). In contrast, Crassostrae gigas exhibited an increase in completeness (+4.38%) and a decrease in consistency (−9.16%).
OMArk also detected the removal or decrease in contamination for three species (Schistosoma mansoni, A. pisum and Glossina fuscipes), as well as new contamination introduced in Teleopsis dalmanni’s latest assembly. Most of the observed changes had no clear correlation with improvement in assembly quality metrics, except the proportion of fragmented genes decreasing with a higher N50 (Pearson correlation: 0.85, P value: 0.002). Our results indicate that new assemblies generally improved gene set quality, changed contamination status and reduced fragmented gene models due to higher assembly contiguity. However, these new assemblies were not necessarily annotated in the same way, making it difficult to discern whether observed changes are due to improved assemblies or to improvements in annotation procedures.
Finally, we compared 1,200 pairs of protein-coding gene annotations, each pair including one annotation from Ensembl and the other from the NCBI (GenBank and RefSeq), both derived from the same assembly. We analyzed the differences in OMArk and BUSCO results for all these pairs of annotations (Supplementary Tables 6 and 8 and Supplementary Fig. 32). NCBI proteomes generally exhibited higher completeness (+1.39%), fewer proteins with no known homologs (−0.64% unknown) and fewer structurally inconsistent proteins (−0.18% partial mapping and −0.64% fragments). Conversely, Ensembl proteomes exhibited a slightly lower taxonomic inconsistency (−0.09%).
Because OMArk’s underlying OMA database predominantly sources its proteomes from Ensembl (74% of Eukaryotic proteomes, Supplementary Fig. 31), we hypothesized this might introduce a bias. We tested this by comparing results on a subset of annotation pairs from species in OMA sourced from Ensembl to the rest of dataset. In this subset, proteomes from Ensembl had fewer detected fragments (−0.27%), fewer partial mapping proteins (−0.28%) and fewer taxonomically inconsistent proteins (−0.28%) than NCBI proteomes. These differences confirm that OMArk is slightly biased due to the reference proteomes’ origin. Thus, NCBI proteomes may appear slightly worse than they actually are, not necessarily due to quality issues but due to discrepancies in gene models predictions compared to Ensembl. However, the quantitative impact of such bias is minimal and unlikely to obscure any major annotation quality issues.
Overall, our findings highlight OMArk as a valuable tool for tracking improvements in genome assembly and annotation. By analyzing other metrics beyond completeness, OMArk can detect changes toward overall better gene sets, even when the completeness decreases. Furthermore, OMArk is effective for comparing different methods or sources of annotation, although users should note that minor differences between proteomes could be attributed to a bias induced by OMArk’s reference proteomes.
Source link